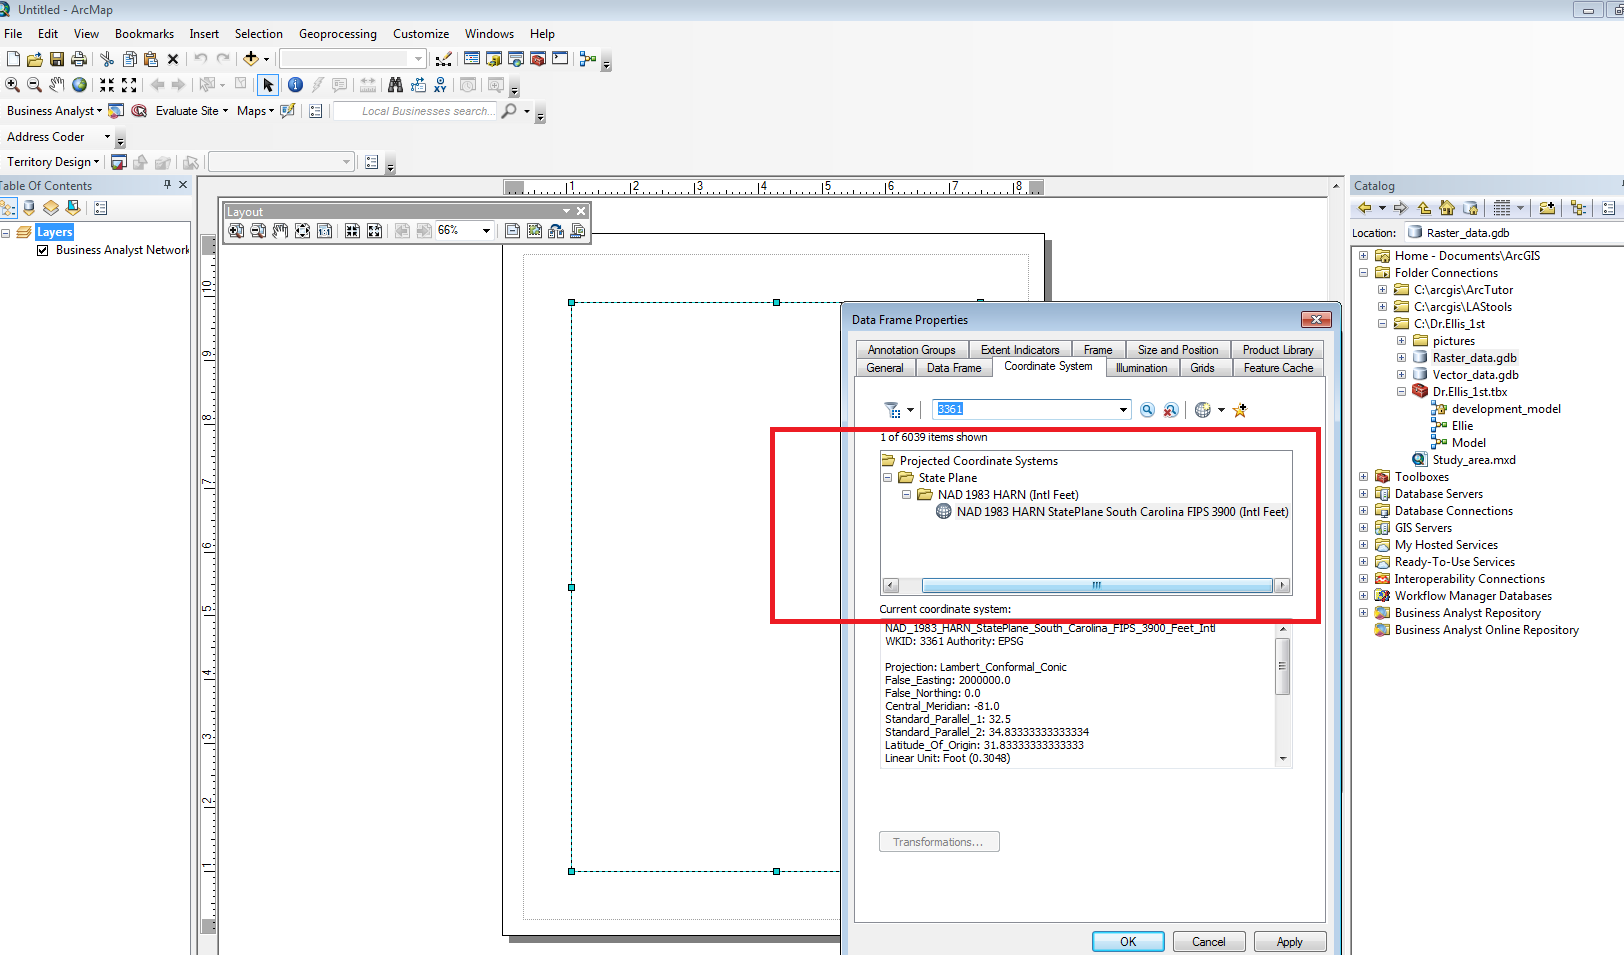
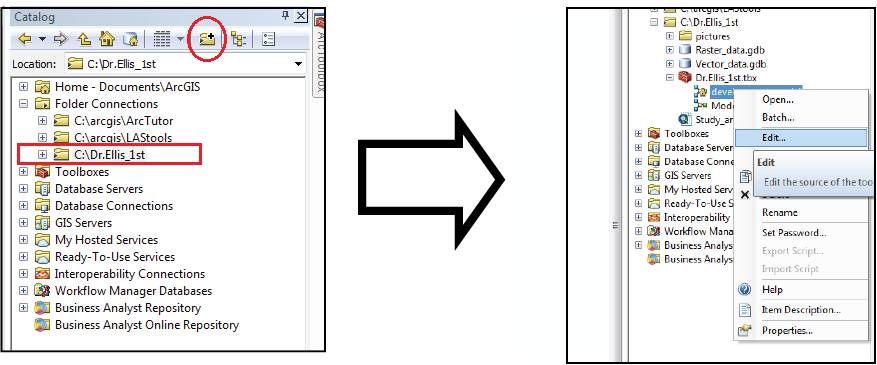
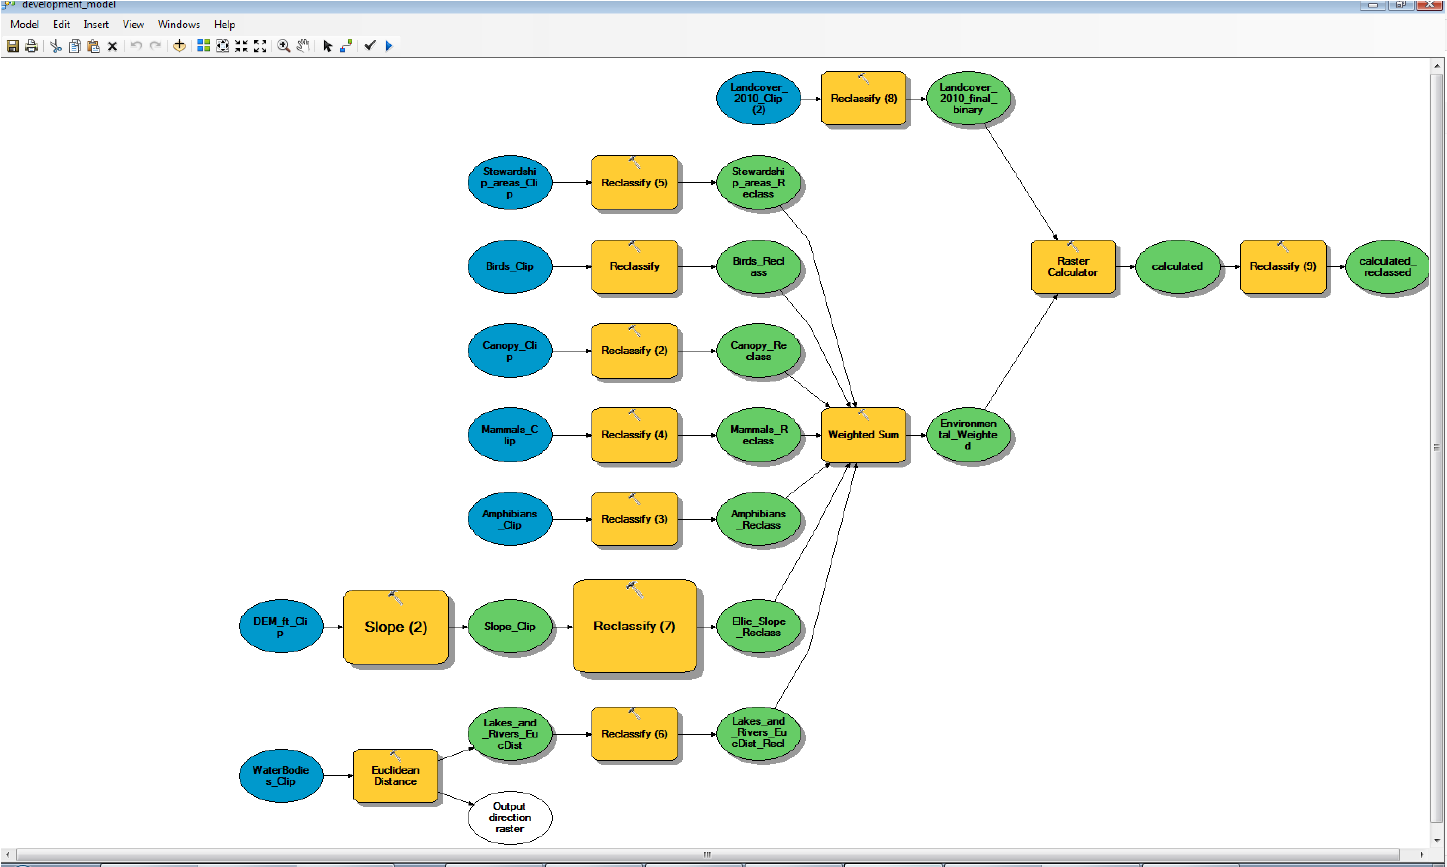
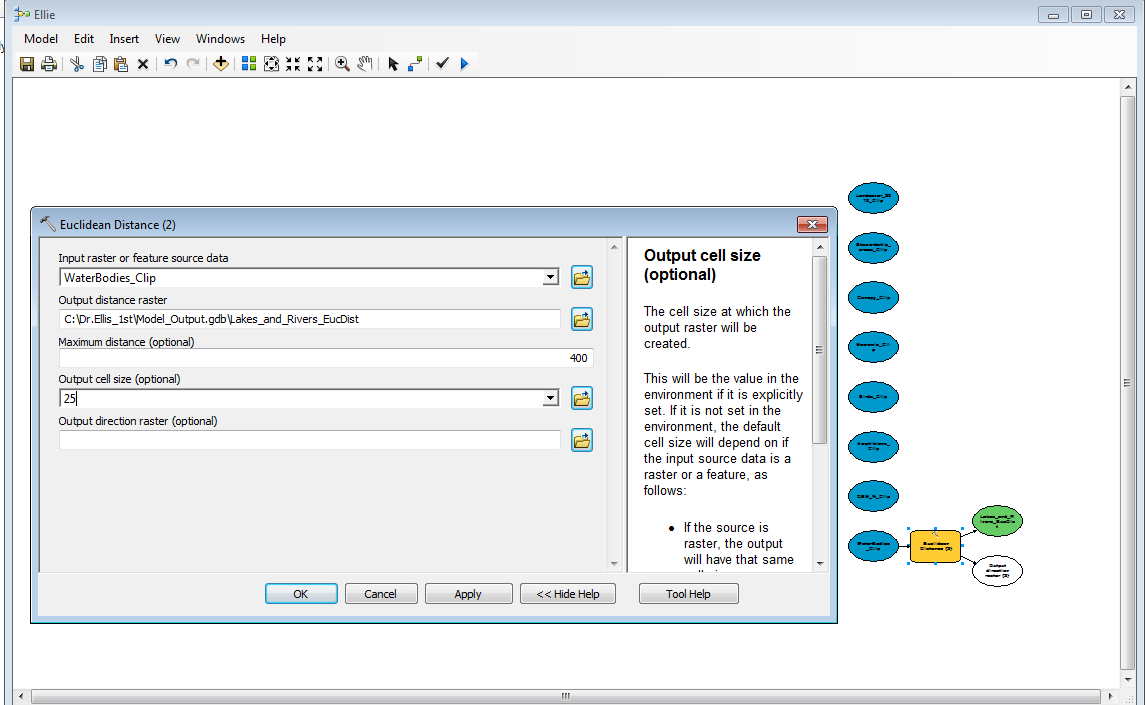
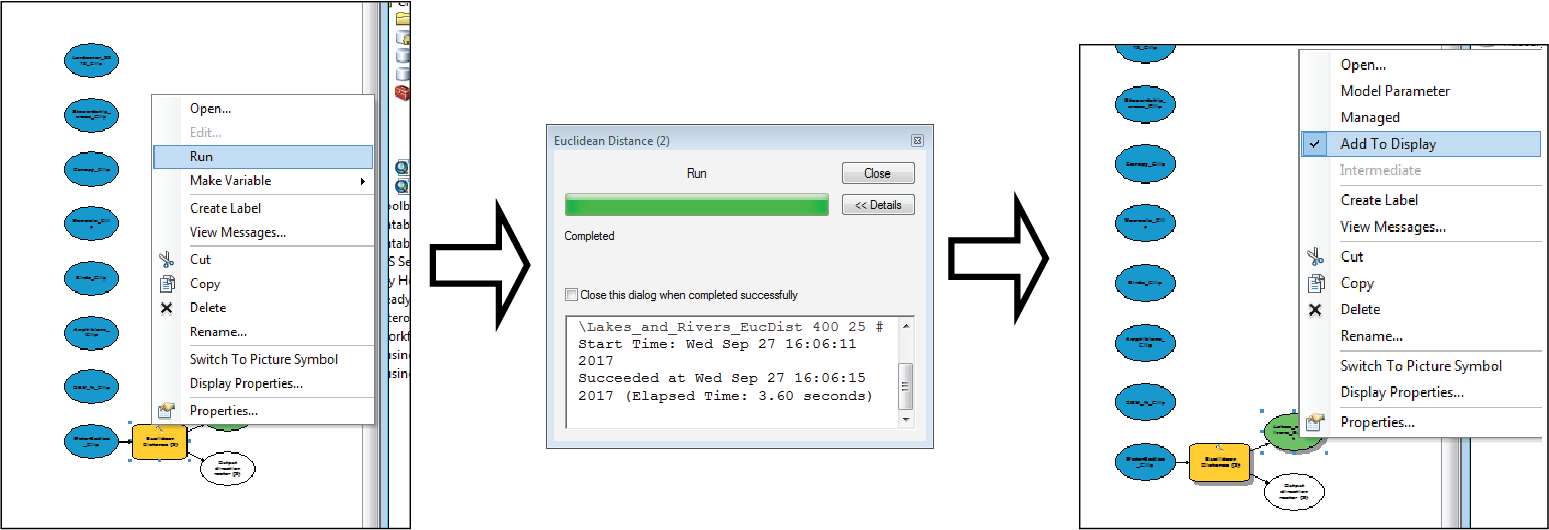
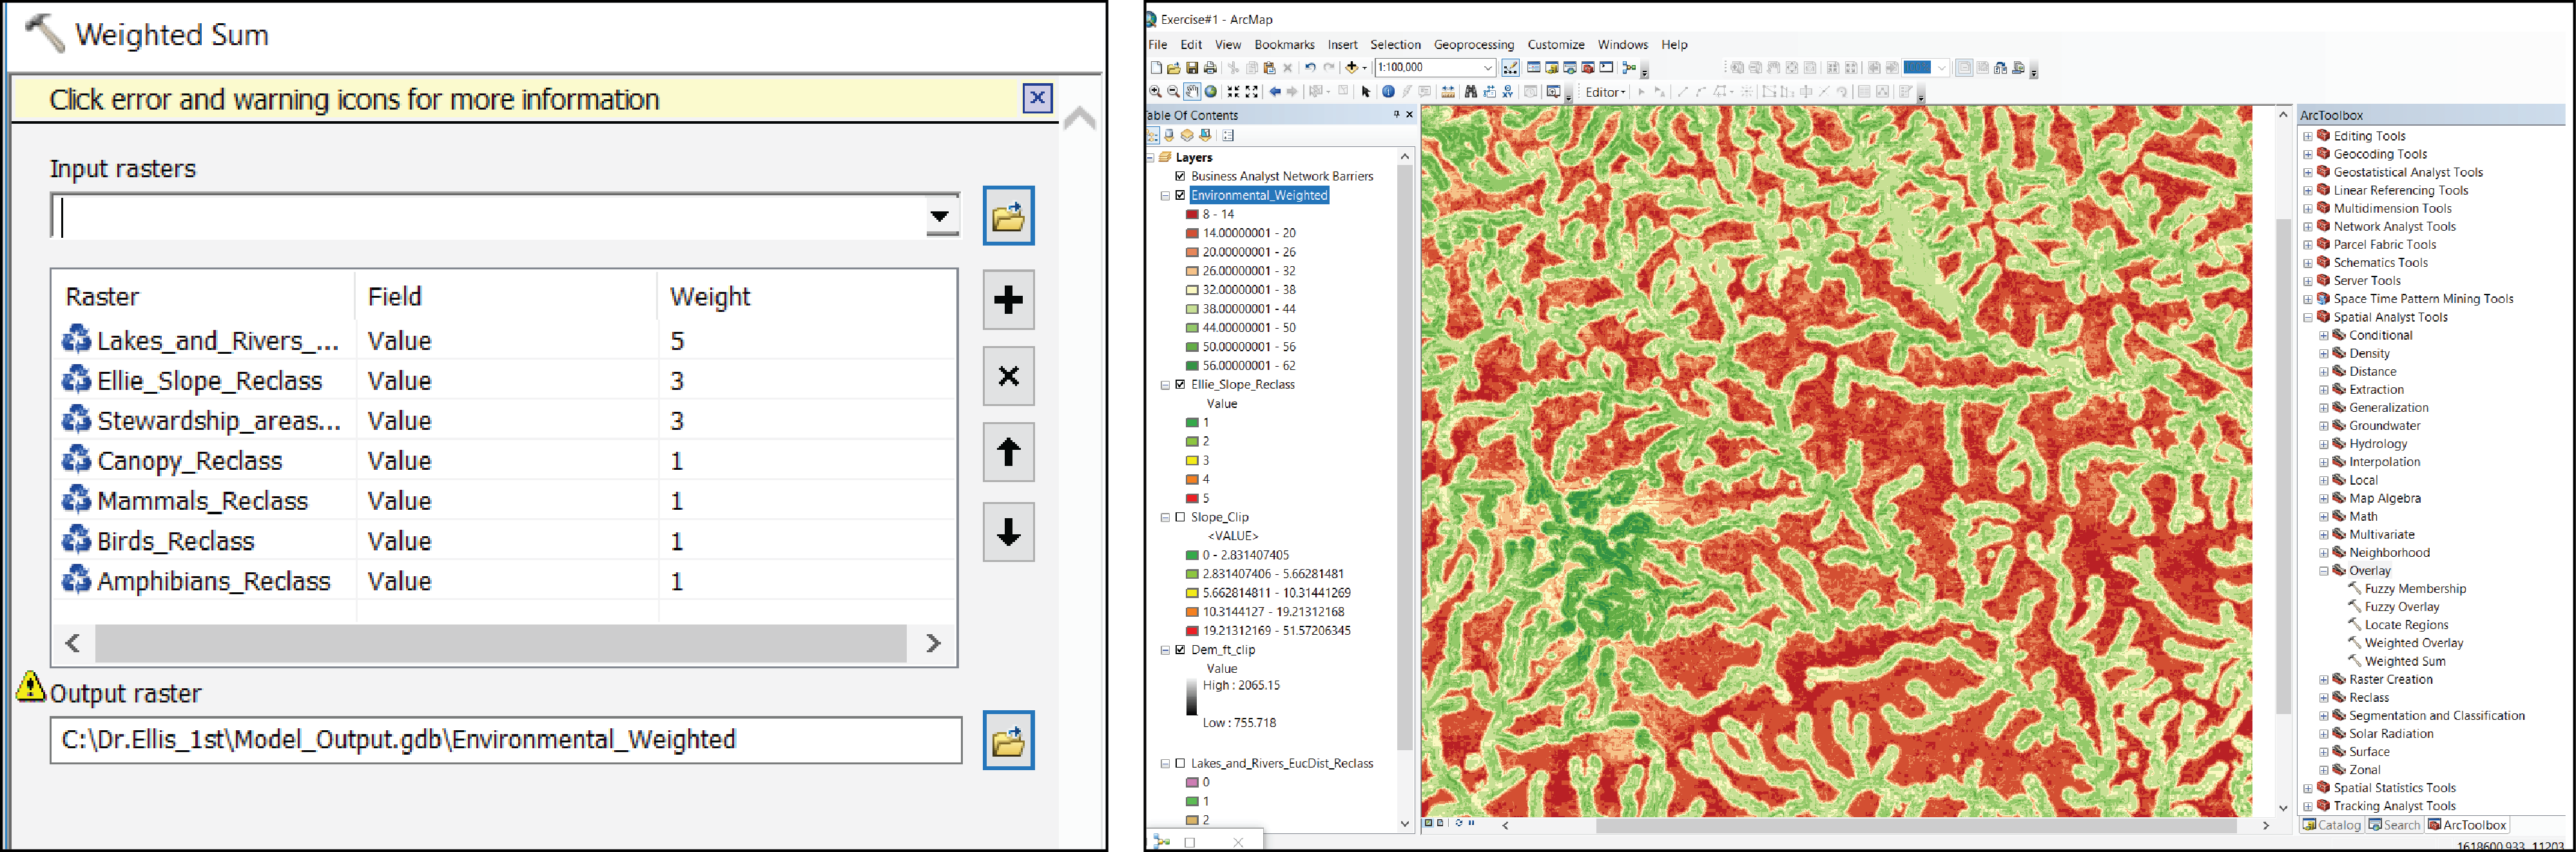
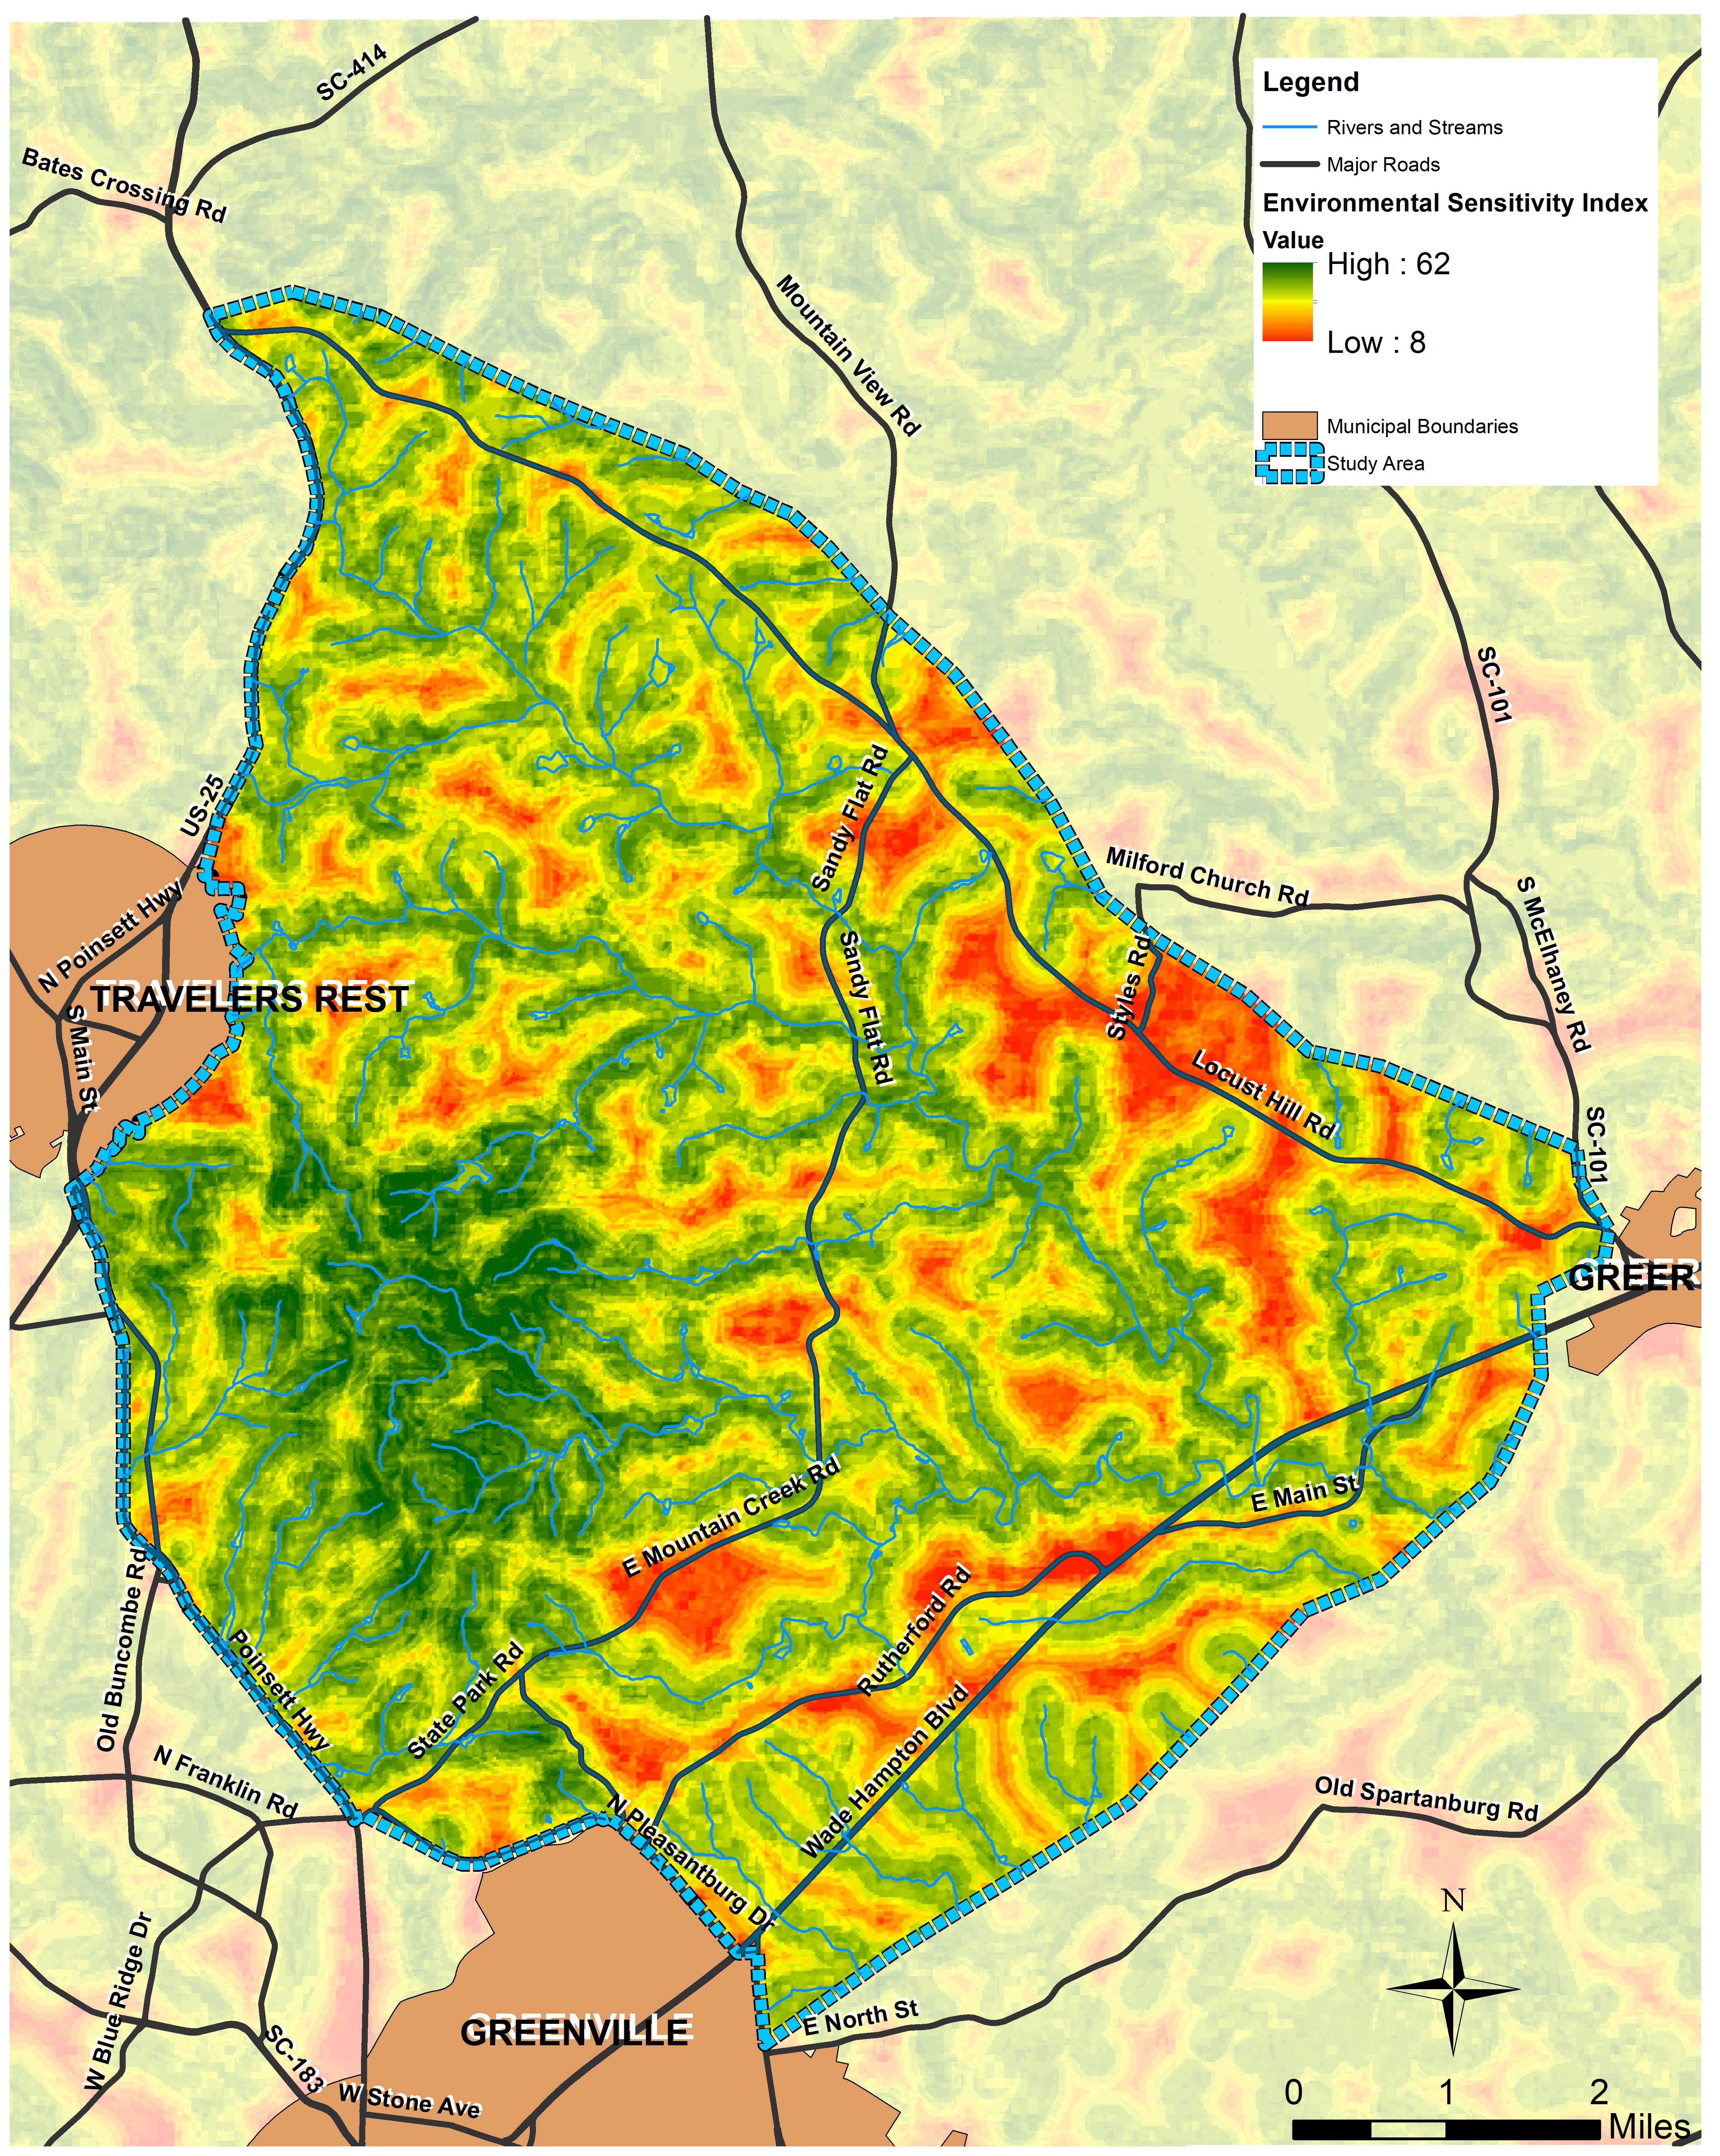
The goal of this project to identify approximately 60 square miles of land that is appropriate for mixed-use development. This project will adhere to environmental, urban development, and socioeconomic models that are indicated in Urban Land Use Planning by Philip Berke (fifth edition). Through the course of this assignment, we will explore the logical possibilities for our development and assess the potentials each geographic location provide. The study area is to the north of City of Greenville and the west of City of Greer, and it shares borders with City of Travelers Rest at its west. This analysis utilizes spatial modeling to facilitate the decision-making process. By visualizing the characteristics of the land, we intend to analyze the geographic features and identify those areas in which development will cause less environmental harm and more socioeconomic benefits for the public. The more detailed socioeconomic aspects of this study, although worth studying further, are not in the scope of this assignment. In other words, this study will not discuss and take into account whether communities are likely to be in favor of a new development in their proximity or not. Moreover, it is not going to include the political will (local powers to lobby, etc.) to initiate such a land use proposal. Economic feasibility and whether the localities are even capable of launching such projects is also excluded from this study. The following, is an introduction to the study area, methods of analysis, demonstration of the results, and conclusion. You may download the data for this exercise from this link. Study Area The study area is located in Greenville County—which is in the northwest part of the state of South Carolina. This area is surrounded by three cities of Greenville, Travelers Rest, and Greer. Spartanburg, Laurens, Abbeville, Anderson, and Pickens in South Carolina, and Polk, Henderson, and Transylvania in North Carolina are counties with regional proximity to the study area. The most dominant trend in this region is the fast-growing urbanized areas surrounded by rural places. This pattern is not unique to these counties as other areas throughout the American South could be identified with same trends. Therefore, the analysis could be a basis for future comparative studies for the regions that share these trends throughout the southeast. The availability of data and access to the information was a contributor in site selection. Geodesign ProcessThis analysis follows Philip Berke’s Urban Land Use Planning and utilizes the geodesign process suggested by Carl Steinitz in his book A Framework for Geodesign. ESRI’s ArcGIS for Desktop with enabled Spatial Analyst extension has been the main tool both for generating and interpreting the data available. To answer the question posed in the assignment, the first step for developing a suitability model was to determine what factors play a role in the final analysis. In other words, the variables which determine whether an area is suitable for development were identified and filtered. Main variables have been selected in two categories: Environmental and general urban development factors. The following is a detailed description of the process model.Ideally such model shall include socioeconomic factors such as median income, population, and more detailed urban development factors such as projected growth, proximity to major roads, etc. However, due to time restrictions and limited access to relevant data, we have only included environmental factors and land cover classification in this model. The diagram below shows the elements that are relevant for building such model. In this exercise, we have only used the ones that are outlined with color red. MethodologyThe routine procedure for such suitability analysis is to calculate a value for each dimension (environmental, urban development, and socioeconomic). After obtaining a value for each, we weight them based on our priorities. For example, if we are more concerned with environmental issues, our environment dimension will get a higher value in overall aggregate value. Or, if we are primarily concerned with economic development, we will prioritize urban development factors over other dimensions of the model. Here, we have prioritized environmental factors.The Environmental FactorsStep 1: Download the folder "Dr. Ellis_1st" and copy the folder directly to your C drive. Open an ArcMap document. Go to your Catalog panel and connect the folder to your map document. Right-click on your data frame and from Data Frame Properties go to Coordinate System tab > Projected Coordinate Systems > State Plane > NAD 1983 HARN (Intl Feet). Select NAD_1983_HARN_StatePlane_South_Carolina_FIPS_3900_Feet_Intl as your projected coordinate system. Now you have defined the projected system for your data frame. Save your map (Figure #1). *** Please click on pictures to see enlarged versions. *** In the folder, you should have two geodatabases and a toolbox. Open your toolbox and open the development_model. Remember, to open your model, you should click on "Edit..." and not "Open..." (Figure # 2). Once you open your model, you should see the model below. In this exercise, we will go through the steps for creating this model (Figure # 3).
Step 2: We have already ran the model, and you should have all the model outputs in your Raster_data geodatabase. However, we recommend you to create a new geodatabase (Model_Output) and set it as your Default Geodatabase so you can compare your model output with the given data. Now, right-click on your toolbox and create a new model. You can rename the model from your toolbox. Drag the following layers from your geodatabases to your model (Figure #4) - From Raster_data.gdb, drag the raster datasets: DEM_ft_Clip, Amphibians_Clip, Mammals_Clip, Canopy_Clip, and Landcover_2010_Clip
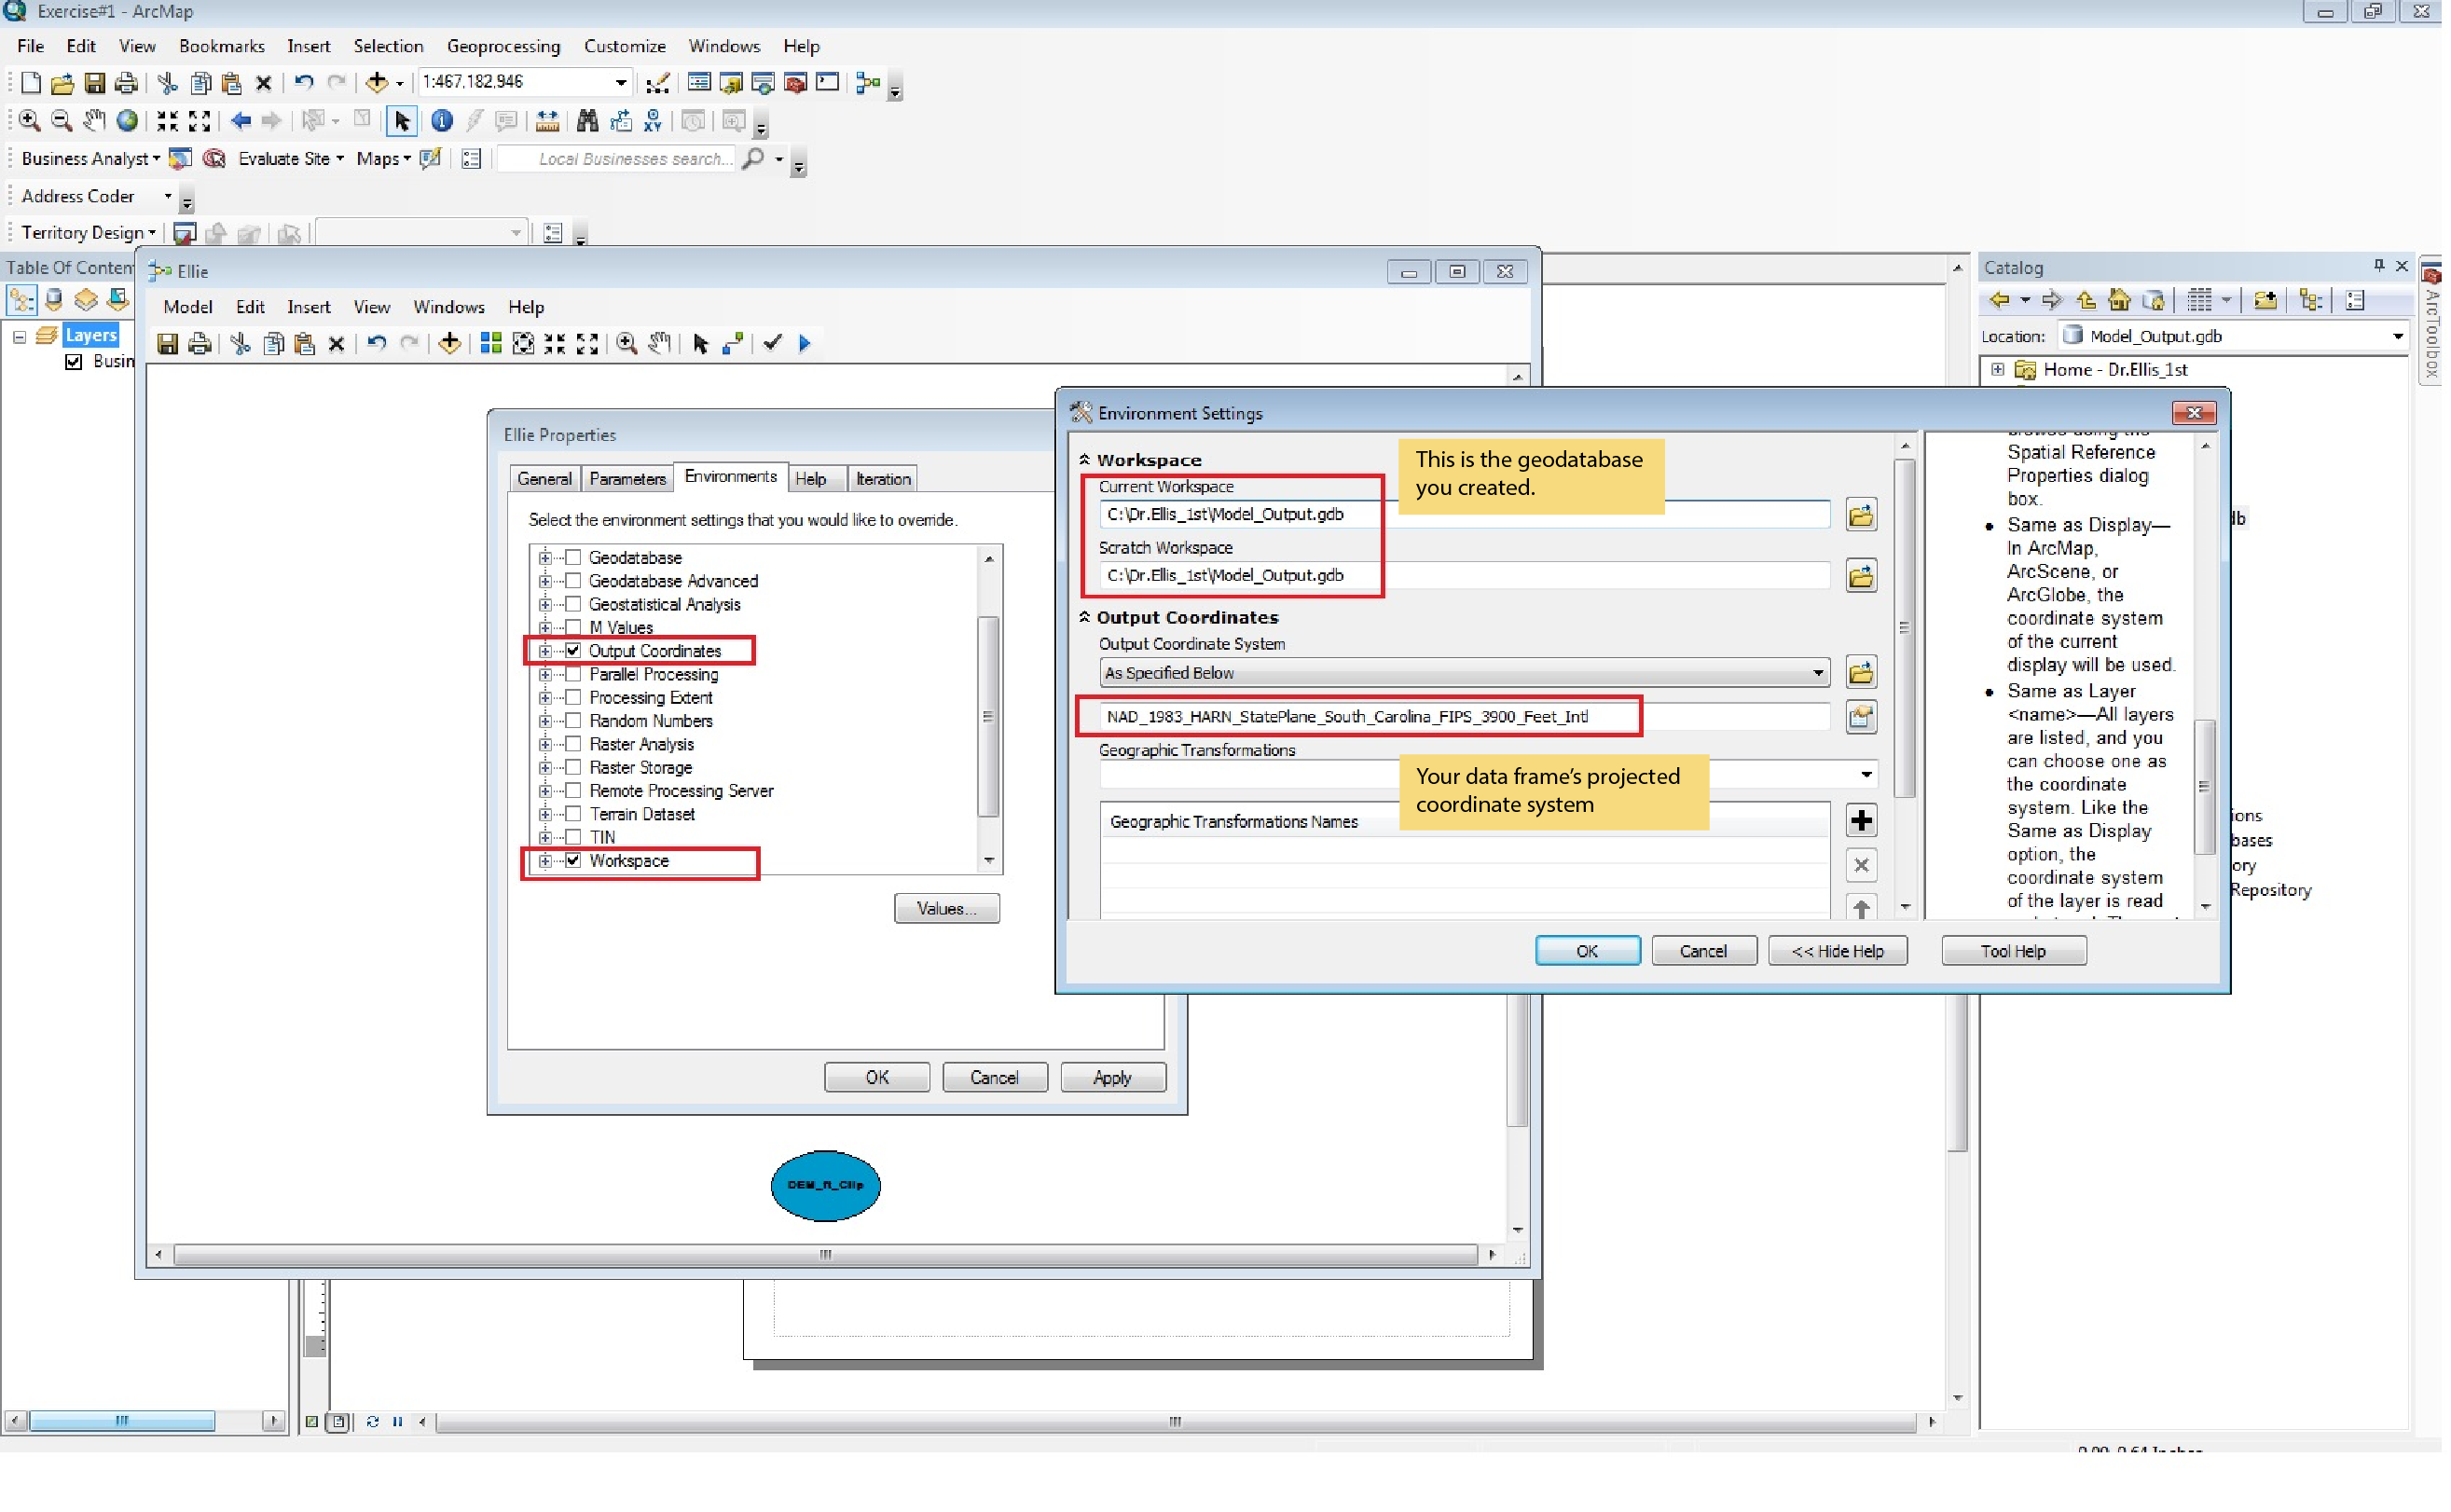
Go to Model > Model Properties and set the following values as displayed in Figure # 5.
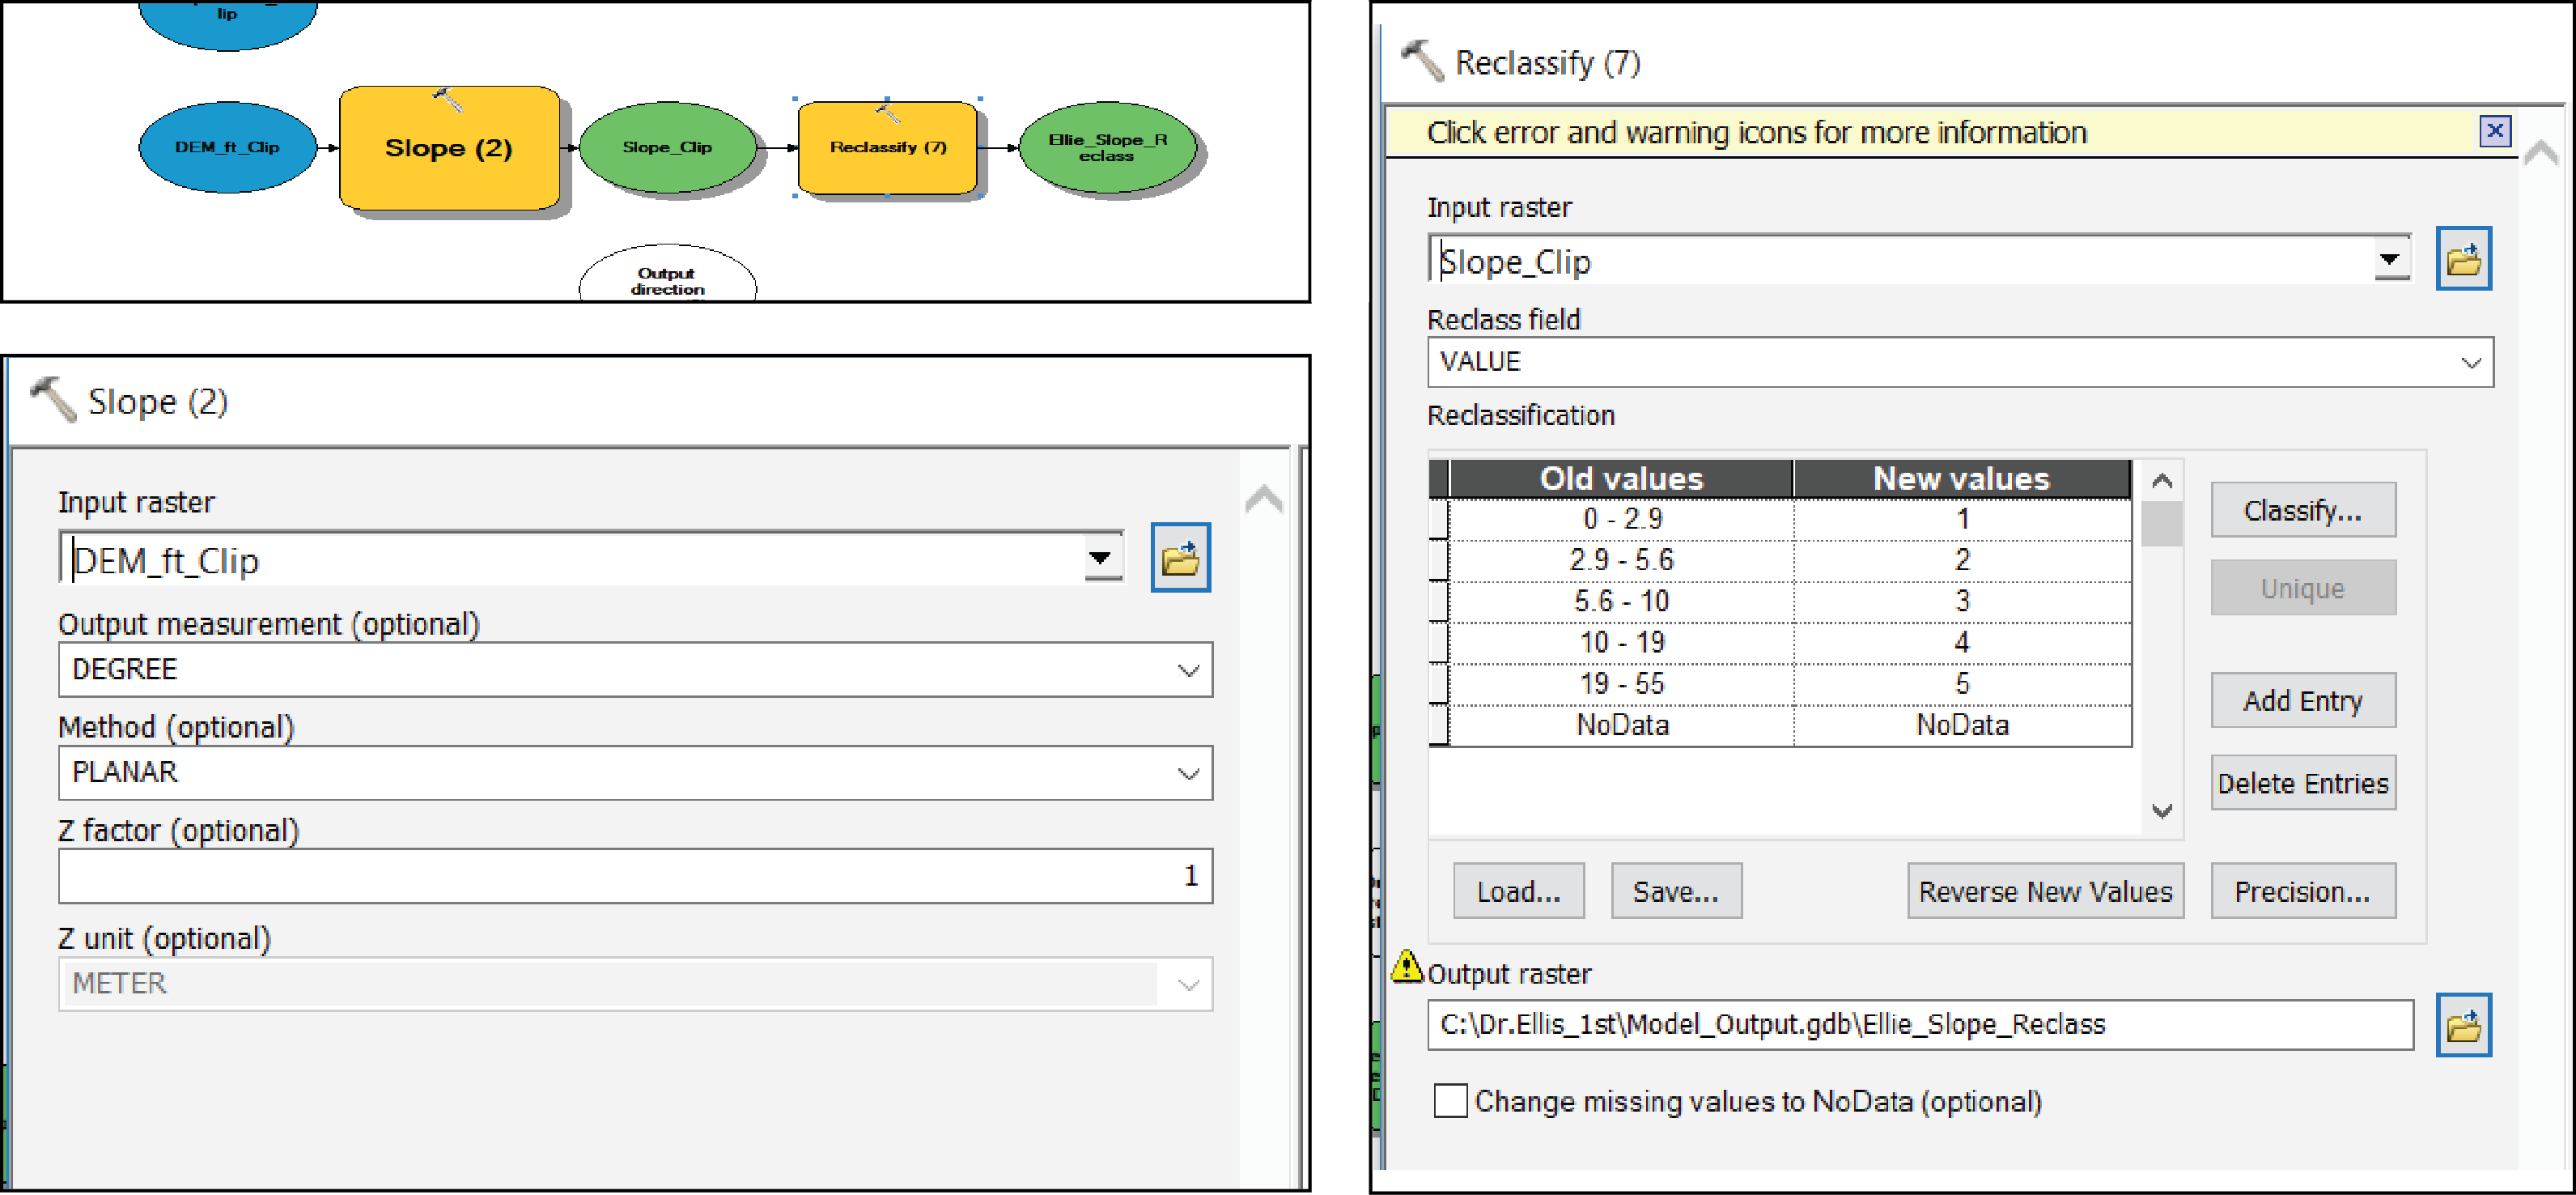
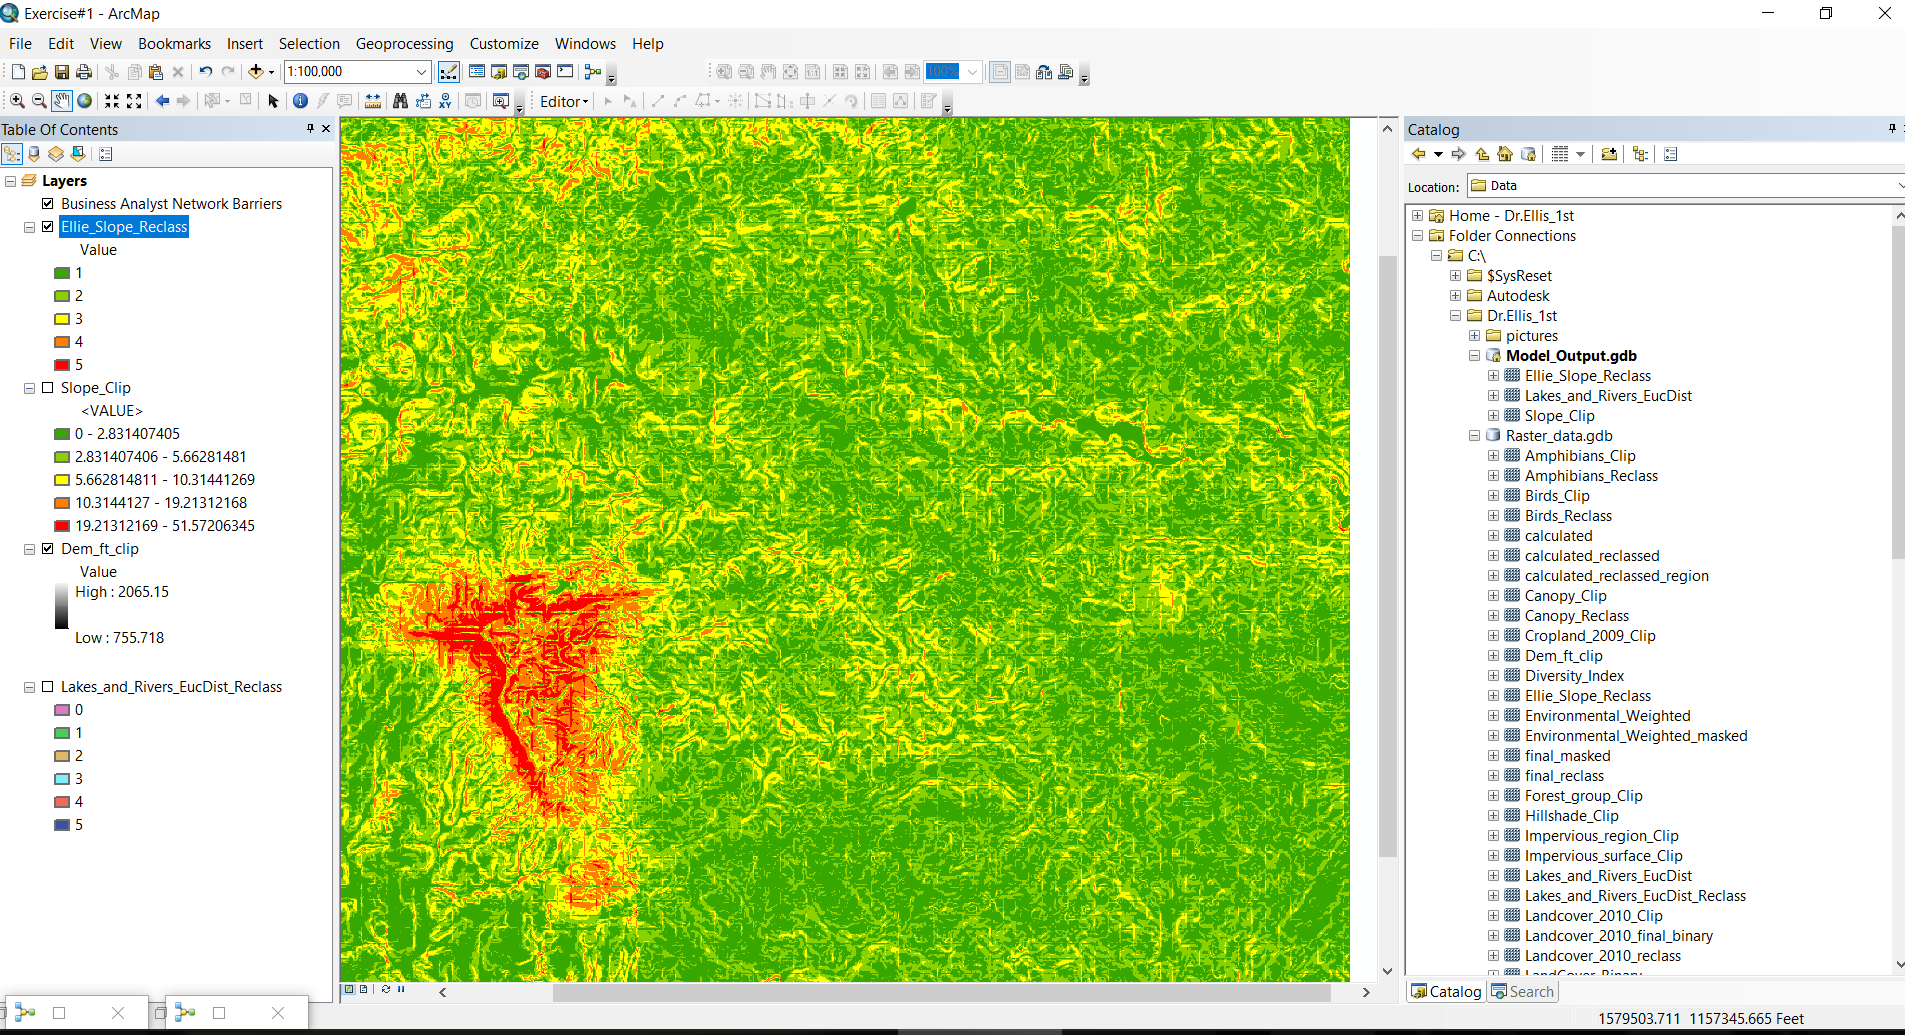
Step 4: In this step, you will create a slope layer from your Digital Elevation Model. DEM is a 3D representation of terrain's surface. To create the slope layer, drag and drop the DEM layer to your model. Drag the Slope tool to your model from ArcToolbox > Spatial Analyst Tools > Surface > Slope. Set the tool setting as Figure # 9. After you run the tool and add the results to your display, your map should look like Figure #10.
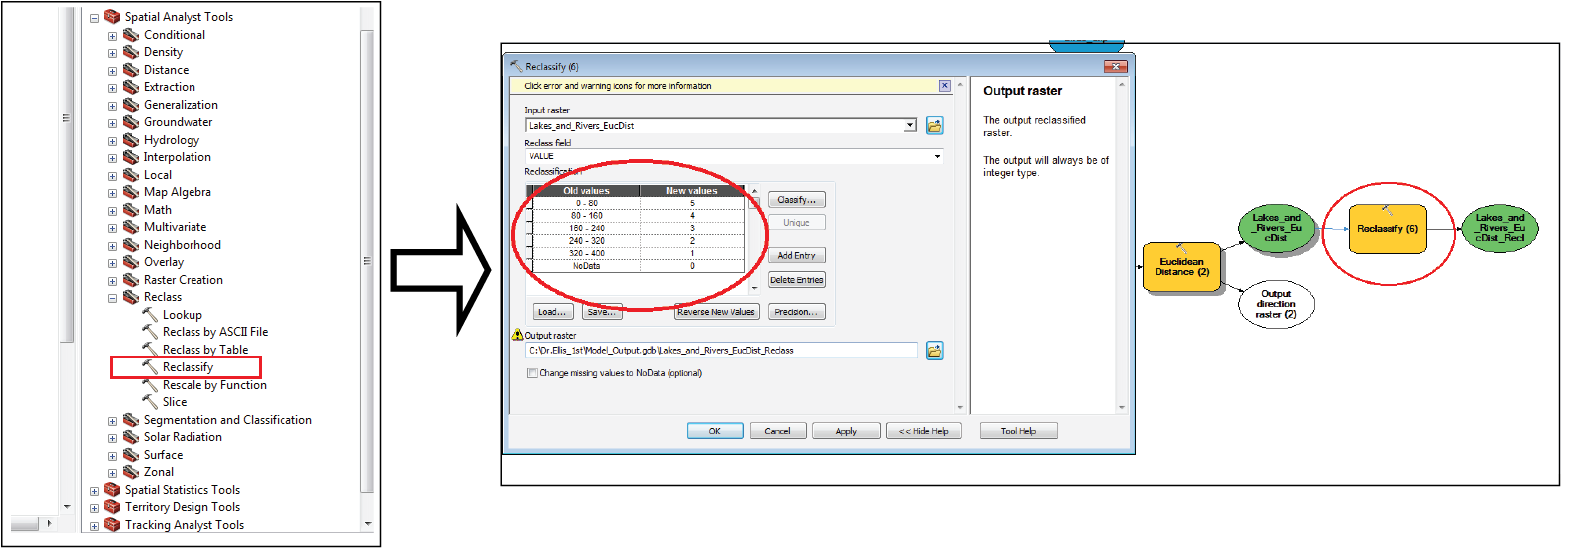
Step 5: Drag the raster datasets Amphibians_Clip, Mammals_Clip, Canopy_Clip, Birds_Clip, and Stewardship_areas_Clip to your model. Reclassify them as Figure 11. 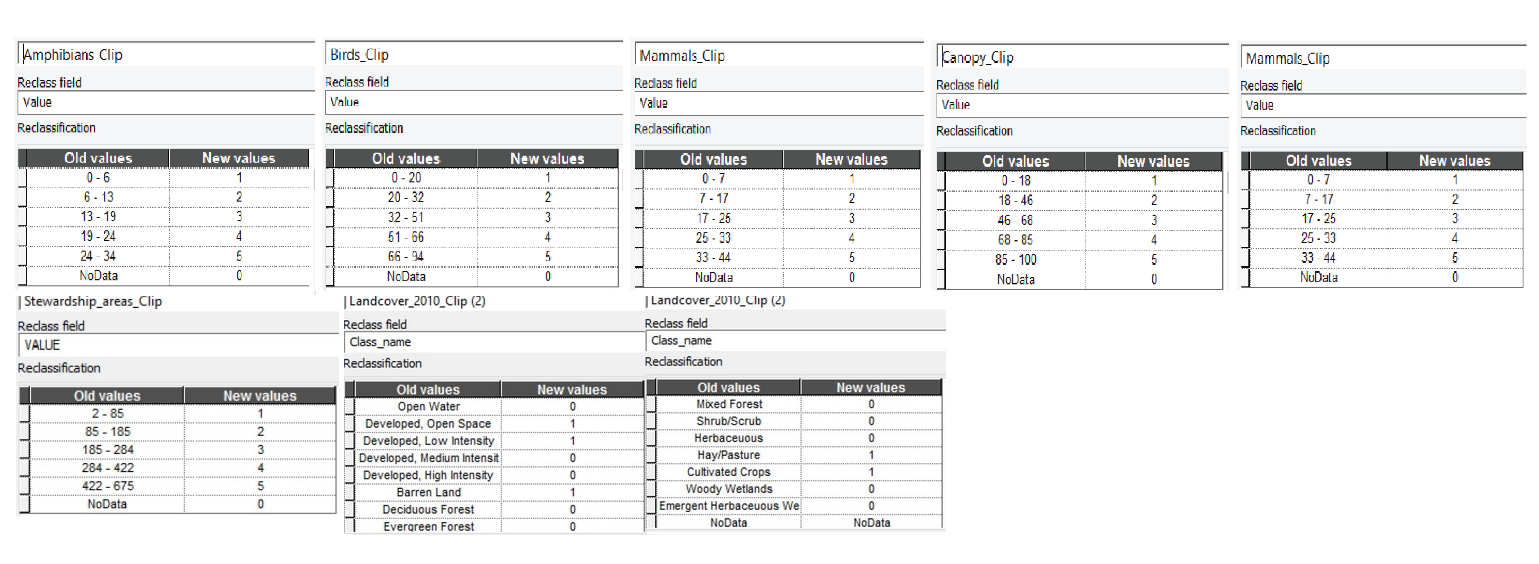 Figure # 11 Figure # 11
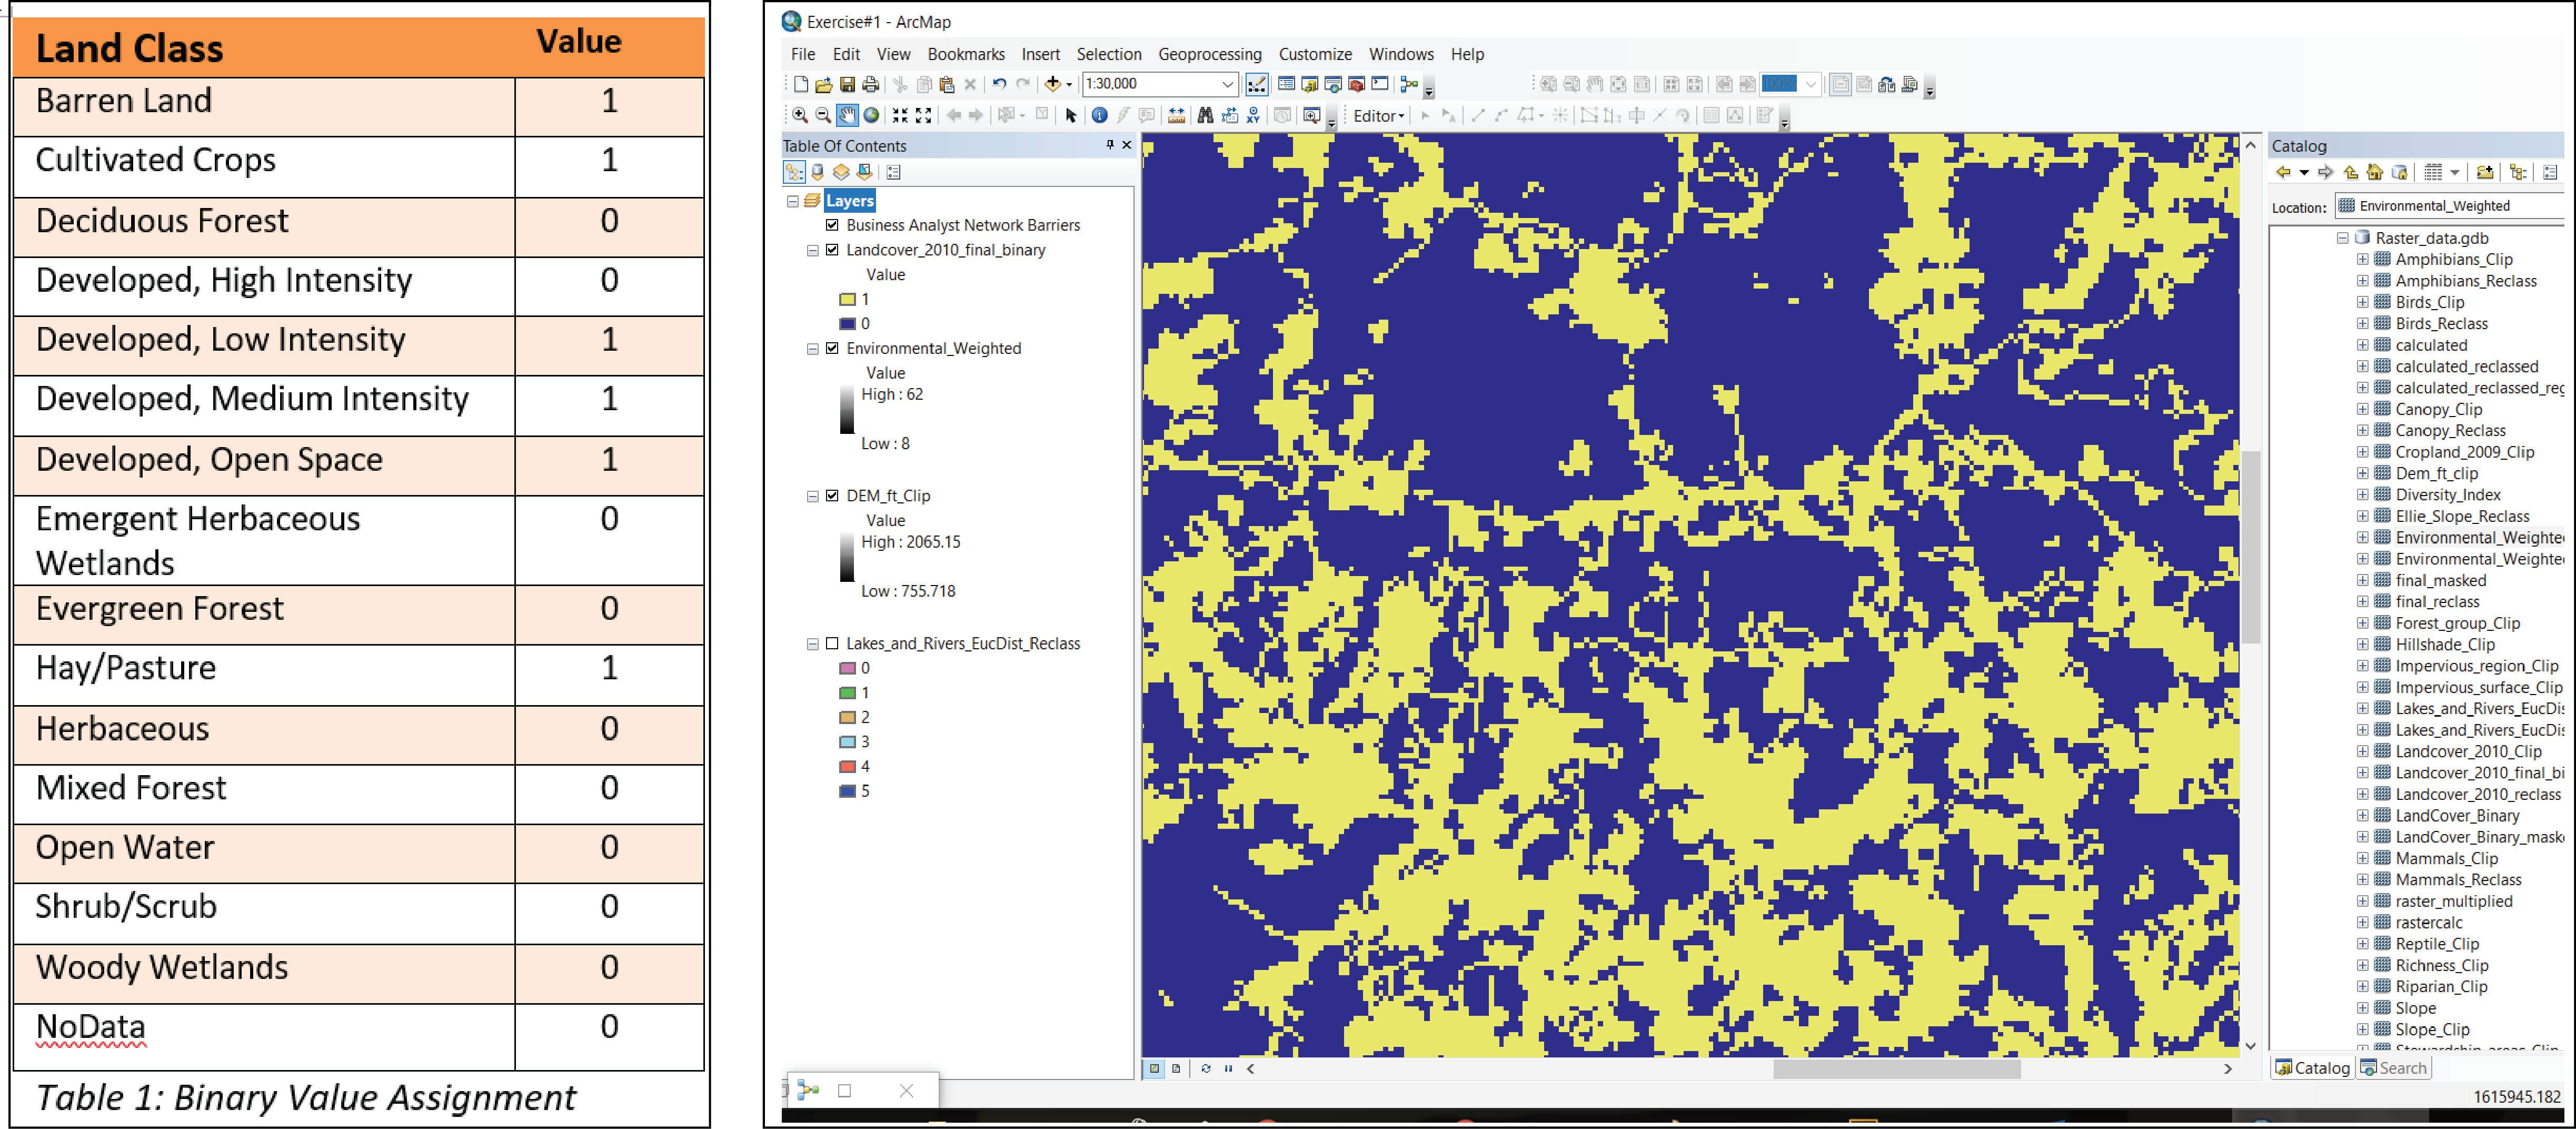
|